Becoming a new parent can be a stressful, but beautiful time.
You're in love with your new bub, but at the same time the upheavel is completely exhausting, zapping all your excited energy in one go.
The first six months of a baby's life is chaotic, you have to help them learn sleeping patterns and feeding times, all new to a baby exiting the womb.

And the disorder could not be more evident than in a graph conducted by two new parents.
Uploading the graph to Reddit, Dad stated: "My wife started collecting data after three months because we were going crazy due to the lack of predictability that comes with having a newborn."
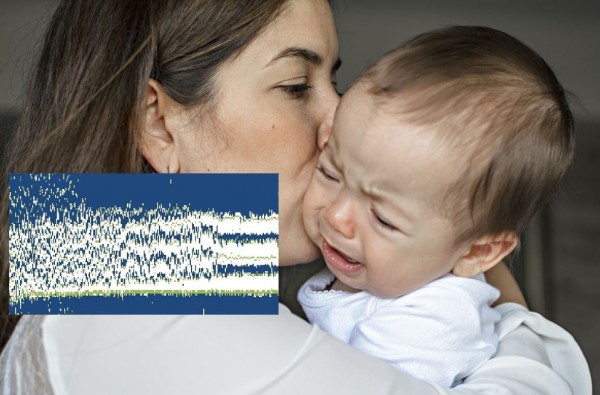
"We found it helpful and just kept going. Each column is one day and each row is a 15-minute block of time."
Months 3 to 17 of my baby's sleep and breastfeeding schedule [OC] (data collected manually and visualized in Excel) from dataisbeautiful
The graph shows struggling new parents how over time your baby will enter a routine pattern so you won't be tearing your hair out with the crazy hours you find yourself awake.
One comment even applauds the graph, and the accuracy which it demonstrates by stating: "The temporal chaos in infant behaviour that gradually smoothes to controlled, directed, and orderly over time."
"The parenting strategies that were implemented over time in terms of implementing and extinguishing nap/bed times and meals."
From the graph you can gauge the times when the parents were running behind or if nap time didn't go according to plan, and what way meals affected the tot.
This chart is absolutely insane, but certainly an eye-opening tool into how things do get better when you're struggling on those tougher days.